Can Machine Learning Predict Olive Oil Prices
Here's What I Found.
The Question
Extra virgin olive oil has had a turbulent few years. Prices roughly doubled between 2022 and 2024, driven by catastrophic harvests in Spain and Italy. As someone with a background in data analysis and machine learning, I wanted to know: could an ML model have seen this coming? And more practically, can ML predict where prices are going next?
I built a forecasting system to find out. The short answer is: not at weekly frequency. But the journey to that conclusion taught me something genuinely interesting about how commodity markets work.
The Data
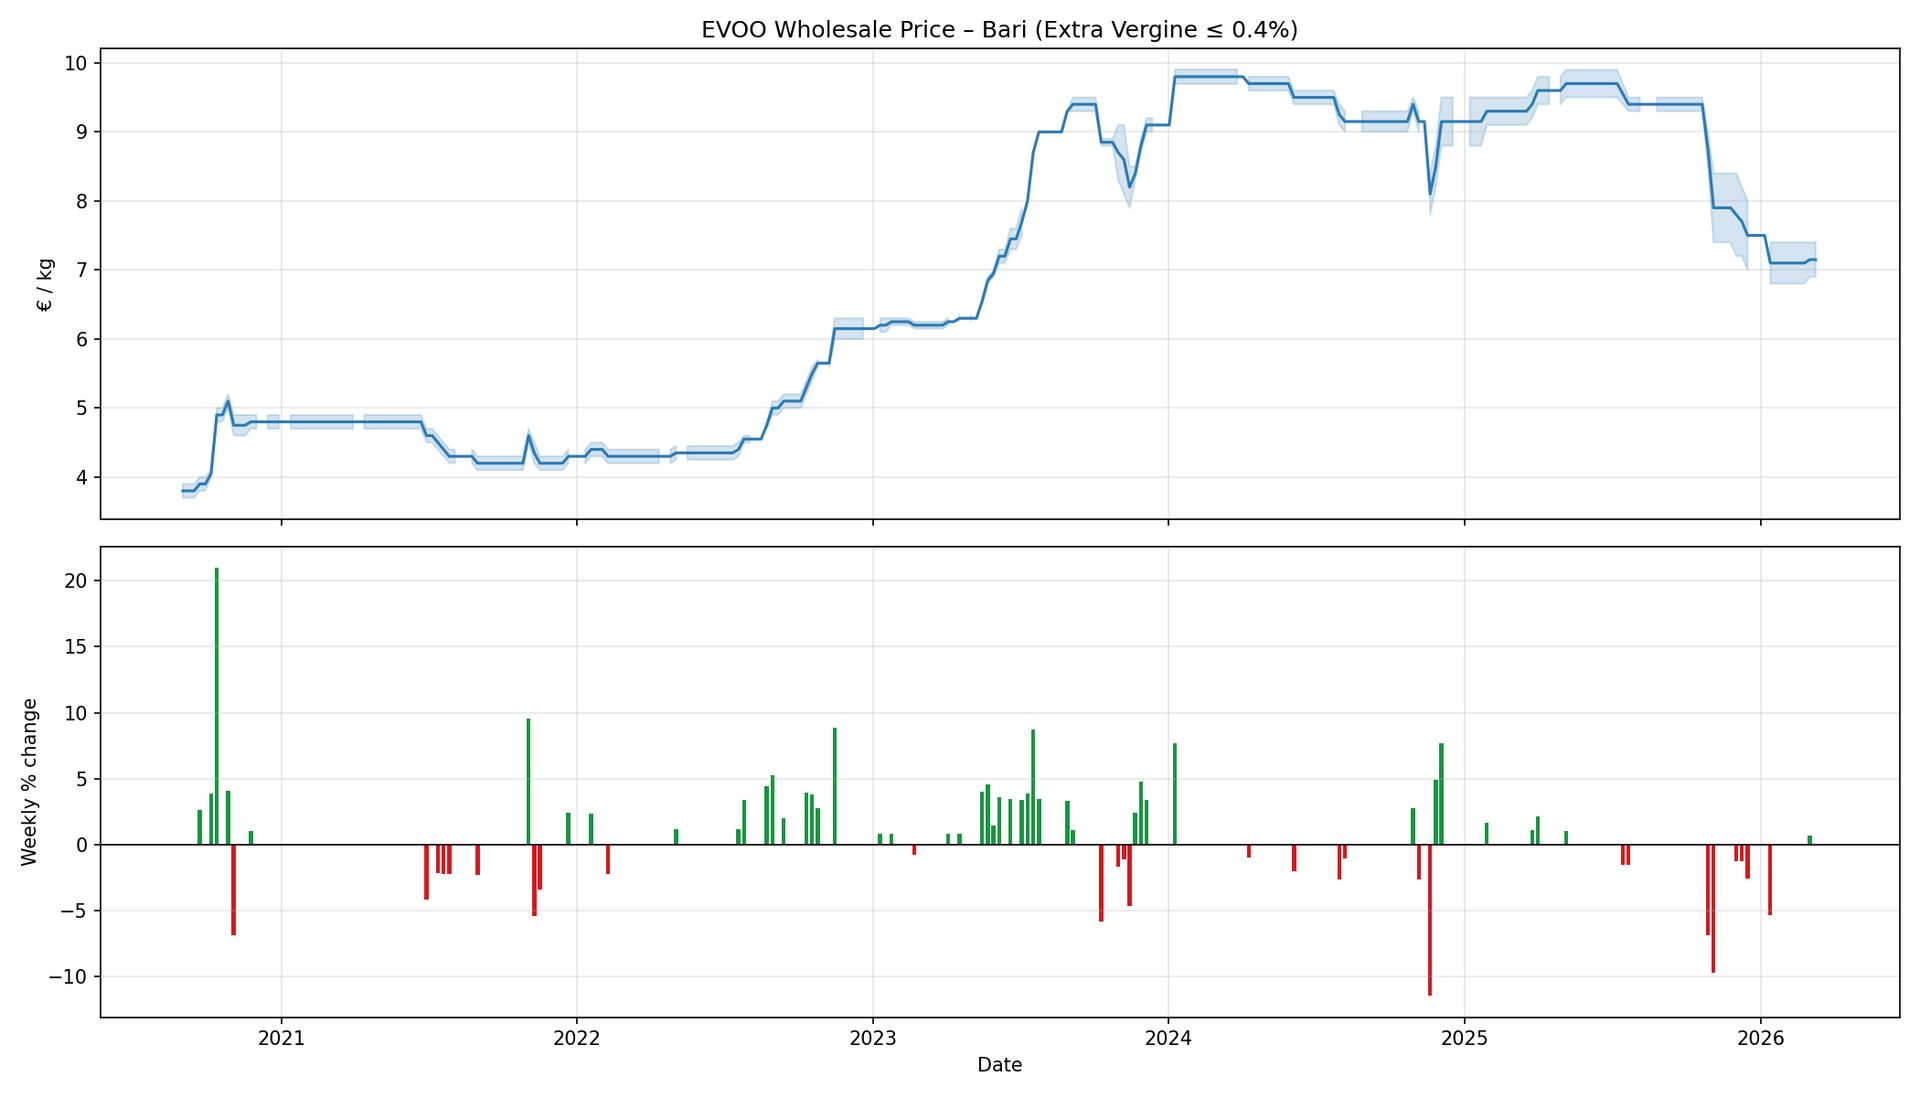
I used weekly wholesale prices for Extra Vergine di Oliva (acidity ≤ 0.4%) from the Camera di Commercio di Bari — the Bari Chamber of Commerce. Bari is the primary reference market for Italian olive oil, and the Chamber publishes a weekly price list that represents genuine wholesale transactions between producers, brokers and buyers in Puglia, Italy's largest producing region.
The dataset covers September 2020 to March 2026 — 289 weekly observations. This period is unusually rich: it captures a cyclical low in 2020, a steady climb through 2022, an extraordinary price spike peaking in early 2024 driven by drought across the Mediterranean, and a partial normalisation thereafter.
The target variable is the weekly percentage price change — calculated from the midpoint of the published minimum and maximum prices each week.
The Features
I assembled features in two layers.
Layer 1 — price history only:
- Lagged weekly price changes (1, 2, 3, 4 and 8 weeks)
- A price level signal (z-score relative to 52-week rolling mean)
- Seasonality (week of year, harvest season flag)
Layer 2 — external signals:
- EUR/USD exchange rate (FRED API)
- Brent crude oil price (FRED API)
- Weekly weather data for Puglia and Andalusia: rainfall, temperature, evapotranspiration, water balance, and 4-week and 13-week rolling aggregates (Open-Meteo API)
- Google Trends search interest for "olio extravergine" and "olive oil price"
- Annual harvest production figures for Italy and Spain (International Olive Council)
The final augmented dataset contained 41 features across 238 usable weekly observations.
The Models
I tested four models at four forecast horizons (1, 2, 4 and 8 weeks ahead):
- Naive baseline — predict zero change every week
- Linear regression — autoregression on lagged price changes
- Random Forest — price history only
- Random Forest — full augmented feature set
Performance was measured on a held-out test set covering January 2024 to March 2026, using three metrics: MAE, RMSE, and directional accuracy.
The Results
ModelMAE h=1RMSE h=1Dir% h=1Naive (predict zero)0.7082.08879.8%Linear regression0.9382.1409.6%Random Forest (prices only)1.0442.06910.5%Random Forest (augmented)1.1752.3146.1%
The naive model won on every metric at every horizon.
A model that simply predicts "prices won't change this week" outperformed every ML approach tested — including one with 41 features drawn from weather data, financial markets, search trends and harvest forecasts.
Why?
Three reasons, in order of importance.
1. The market is efficient at short horizons. Weekly price changes in the Bari wholesale market are essentially unpredictable from publicly available information. This is the weak form of the Efficient Market Hypothesis applied to a commodity market: by the time a signal is observable, the market has already incorporated it into prices. Traders and brokers in Bari are reading the same weather forecasts and harvest reports we used as features — they've already acted on them.
2. Most weeks nothing happens. Over 73% of weekly observations showed a price change of less than 0.5% in either direction. A model that always predicts zero is correct three weeks out of four by construction. This makes the naive benchmark exceptionally hard to beat and means directional accuracy is a misleading metric when applied to all weeks indiscriminately.
3. The real signals operate at the wrong timescale. The most important features identified by the Random Forest were
precip_mm_13w
(13-week rolling rainfall in Puglia),
eurusd
, and
precip_esp_13w
(13-week rolling rainfall in Andalusia). These are genuine, meaningful signals — but they drive prices over months, not weeks. A drought in Andalusia in July doesn't move the Bari price list the following Tuesday. It moves prices gradually over the following harvest season as the supply deficit becomes real and undeniable.
What the Models Did Learn
Despite failing to beat naive, the models consistently agreed on which features carry the most information:
- 13-week rolling rainfall in both Puglia and Andalusia — accumulated water stress over a quarter, not a single week
- EUR/USD exchange rate — EVOO is heavily exported to dollar-denominated markets; a stronger euro compresses export margins and softens domestic prices
- Week of year and price level relative to history — the market has a seasonal rhythm and a tendency to mean-revert from extremes
These findings are not noise. They are a description of how the EVOO market actually works — driven by structural fundamentals at seasonal frequency, not by short-term momentum or technical signals.
The Honest Conclusion
Weekly EVOO wholesale prices are not reliably predictable from the signals tested. This is not a failure of the models — it is a finding about the market.
The more interesting and tractable question is whether these signals can predict the direction of the seasonal price trend — whether prices will be materially higher or lower in 3 to 6 months. That is a question the harvest data, accumulated weather signals and exchange rate are much better positioned to answer, and it is the subject of the next phase of this project.
Data source: Camera di Commercio di Bari. External signals: FRED, Open-Meteo, Google Trends, International Olive Council. Code and dataset available on GitHub.